![Assembly Basics [32-bit, Linux, GDB]](https://cdn.cyberpunk.rs/wp-content/uploads/2020/06/assembly_basics_bg.jpg "Assembly Basics [32-bit, Linux, GDB]")
Assembler… learning it maybe an unreachable & elusive goal for some, others probably don’t even want to try and understand it. Nowdays, things are easier, but for old school boys & girls, trying to learn it from books and rare manuals was difficult. It was a time of pascal, modems and internet development. Learning, figuring out the unknown structures, registers, inner workings when you didn’t even knew what half of those things were. It’s understandably demoralizing. Low level s***, the real deal. Virus evolution playground. If you get to understand it, you’ll be able to bend the matter around you, dodge bullets, you’ll become the one, a part of the matrix.
Bits, bytes, words, registers, subregisters,.. finding the right compilers in windows and/or linux. Well, writting this I’m probably expressing an overly subjective perspective, but I doubt I’m far from the truth (for the most part).
Assembly and a full understanding of its inner mechanisms is a vital part/skillset of any reverse engineer & tech savy person. It’s useful on so many levels. This is basically a collection of various info on Assembly language & subjects, for future reference and related segements. Use what you can…
- CPU
- CPU Registers
- Memory
- Linux System Calls
- Data types
- Assembly Instructions
- Building Process
- Loading Process
- Functions and Stack
- Moving values around
- Jumps (UnConditional & Conditional)
- Function(s)
- BufferOverflow examples
- GNU Debugger (GDB)
Related articles:
CPU
Different CPU’s have different assembly language ( Intel, ARM, MIPS ). Starting with the brain, CPU consists of a couple of units:
Execution unit: Execution of instructions- Internal CPU Bus
Registers: Internal memory locations used for “variables”Control Unit: Retrieve / Decode Instruction, Retrieve / Store data from/in memoryFlags: Indicators of various “events” (zero flag => instruction ends with zero)
CPU Registers
Basically a small amount of really fast storage. For CPU to reach its full potential in data processing, access speed is vital. Looking at the memory/storage pyramid, there’s nothing faster:
- Registers
- Cache
- RAM
- SSD
- HDD
General purpose registers for general usage:
EAX: Accumulator register, used for storing operands and result dataEBX: Base register, data pointersECX: Counter register, use for loopsEDX: Data register, I/OESI: Data Pointer Register, memory operationsEDI: Data Pointer Register, memory operationsESP: Stack Pointer registers, points to the top of the stack frameEBP: Stack Data Pointer register, stack data pointer, pointing towards the bottom of the current stack frame.Registers (32 bit) have a subsegments we can access independently:
31                     16 15         8 7          0
|-------------------------------------------------|
|                       EAX                       |
|------------------------|------------------------|
|                        |           AX           |
|------------------------|------------|-----------|
|                        |     AH     |     AL    |
|------------------------|------------|-----------|

EAX   31 <EAX> 0
      31 .. 16  15 <AX> 0
      31 .. 16  15 <AH> 8 7 <AL> 0
Segment registers (16 bits):
CS (Code segment, .text section): Base location of code section, used for fetching instructionsDS (Data segment, .data section): Default location for variables, used for data accessesSS (Stack segment): Used when implicitly using SP/ESP or explicitly using BP/EBPESFSGS
Instruction Pointer Registers:
EIP: Instruction Pointer
Control Registers (7 of them):
CR0: Various control flagsCR1: Reserverd, #UD Exception on accessCR2: Page Fault Linear AddressCR3: Used when virtual addressing is enabled
Memory
All processes are placed in the same memory space, but the OS and CPU maintain an abstraction of “Virtual memory space”. There’s a complete study on VM and algorithms, optimal management, etc. VM is an OS capability to “manage” memory shortages by transferring data from RAM to a disk storage. It creates an illusion of a very large memory spac, mapping the memory addresses used by a program (virtual addresses) into a physical ones in computer memory.
Physical memory is exactly what the word says, a memory installed on the computer (RAM), but inside the CPU it’s converted to address space. Depending on the system architecture, for instance on 32 bit systems, that address space is organized in 8-bit bytes. Each byte is assigned to physical address. The physical address space of a CPU varies, 2^32 – 1 (4 GB) or 2^64 (64 GB). OS will use CPU’s MMU (Memory Management Unit) to access the actual memory (RAM or page/swap). MMU’s going to provide features such as segmentation, paging, etc. There are 3 memory models:
Flat: memory appears like a single, linear addr spaceSegmented: Independent addr spaces => Segments, .code , .data and stacks are typically contained in separate segmentsReal-address:
Pages (blocks of adjacent virtual memory addresses of a virtual address space) and Swapping (moving pages from/to secondary storage to/from main memory)The 32 bit EFLAGS registers contains a group of status, control and system flags:
CF: Carry FlagPF: Parity FlagAF: Adjust FlagZF: Zero FlagSF: Sign FlagOF: Overflow Flag
When it comes to Little Endian vs Big Endian, the Intel CPU’s access the memory (and stores in it) in Little Endian order instead of Big Endian used by other CPU’s. Little Endian means that the least significant byte is stored first, at the lowest memory address.
int: Byte3 Byte2 Byte1 Byte0

        HIGH
|-------------------|
| B3 | B2 | B1 | B0 |
|-------------------|
        LOW
Each process has independent piece of memory at its disposal. Program memory organization:
       HIGH
|----------------|
|      STACK     |  -> Storing function arguments/parameters, local vars
|----------------|
|  Unused memory |
|----------------|
|      HEAP      |  -> memory for allocation (DynMem), malloc()
|----------------|
|      .bss      |  -> unitialized data/variables
|----------------|
|     .data      |  -> initialized data/variables
|----------------|
| .global _start |  -> callable routines
|     _start     |  -> main routine
|     .text      |  -> code of a program, compiled, read-only
|----------------|
       LOW
Stack grows downwards, Heap grows upwards. Stack as discussed in some of our posts is LIFO:
       HIGH
|----------------|
|      0xAA      |
|----------------|
|      0x99      |
|----------------| <--- ESP (top of the stack)
       LOW
PUSH : places a value on top
POP : removes a value from the top
Linux System Calls
System call is the fundamental interface between an application and a Linux kernel. A list of them is available in /usr/include/asm/unistd.h, e.g. read(), exit(), write(). Executed via software interrupt (INT 0x80). General rule on how to pass parameters to syscalls:
- EAX – System call number
- EBX – First parameter
- ECX – Second parameter
- EDX – Third parameter
- ESI – fourth parameter
- EDI – fifth parameter
Finding out the system call numbers, check:
/usr/include/asm/unistd.h
/usr/include/x86_64-linux-gnu/sys/syscall.h
/usr/include/x86_64-linux-gnu/asm/unistd.h
/usr/include/x86_64-linux-gnu/asm/unistd_64.h
/usr/include/x86_64-linux-gnu/bits/syscall.h

$ printf "#include \nSYS_read" | gcc -m32 -E -
Example: exit(0) -> void exit(int status). Sys call for exit() is 1, status 0, complete program:
.text
 .globl _text
 _start:
    movl $1, %eax
    movl $0, %ebx
    int $0x80
Using GNU develpoment tools, like assembler to convert that to object and linker:
$ as -o exit.o exit.asm
$ ld -o exit exit.o
Looking at the syscall write (syscall = 4) procedure (Manual):
ssize_t write(int fd, const void *buf, size_t count);
EAX=4
EBX=fd (stdout = 1)
ECX=buf (pointer to a memory location containing the string)
EDX=count (bytes)
.data
 hello:
    .ascii "Hello world"
 .text
 .globl _text
 _start:
    # write
    movl $4, %eax
    movl $1, %ebx
    movl $hello, %ecx
    movl $11, %edx
    int $0x80

    # exit
    movl $1, %eax
    movl $0, %ebx
    int $0x80
Data types
In assembly language there are no “distinct” data types like we have in some high-level languages (string, int, float, etc.). Instead of that, we have a very basic types. There are directives that instruct assembler to reserve a specific amount of memory for the “data” element to be referenced by the label. Directives:
.ascii: string.asciz: Null terminated string.byte: 1 byte.int: 32 bit integer.long: 32 bit integer (same as .int).octa: 16 byte integer.quad: 8 byte integer.single: single precision floating-point number (same as .float).short: 16 bit integer.float: Single precision floating point number.double: Double precision floating point number.comm: declares common memory area.lcomm: declares local common memory area
Sample:
.data
   varAscii:
       .ascii "ABCDEF"
   varByte:
       .byte 10
   varFloat:
       .float 10.10
   varArray:
       .int 10,11,12,13
.bss
   .comm LargeBuffer, 15000
Additional assembler options for easier gdb disassembly:
-gstabs : Produce debugging information in stabs format (if that is supported), without GDB extensions. This is the format used by DBX on most BSD systems. On MIPS, Alpha and System V Release 4 systems this option produces stabs debugging output which is not understood by DBX or SDB. On System V Release 4 systems this option requires the GNU assembler.-gstabs+ : Produce debugging information in stabs format (if that is supported), using GNU extensions understood only by the GNU debugger (GDB). The use of these extensions is likely to make other debuggers crash or refuse to read the program.If we assemble and check the previous “hello” example:
$ as -gstabs -o hello.o hello.asm
$ ld -o hello hello.o
$ gdb ./hello

(gdb) list
 1
 2    .data
 3
 4    hello:
 5       .ascii "Hello world"
 6
 7    .text
 8
 9    .globl _text
 10
 (gdb)
 11    _start:
 12       movl $4, %eax
 13       movl $1, %ebx
 14       movl $hello, %ecx
 15       movl $11, %edx
 16       int $0x80
 17
 18       movl $1, %eax
 19       movl $0, %ebx
 20       int $0x80

(gdb) info variables

0x0804a000  hello
0x0804a00b  __bss_start
0x0804a00b  _edata
0x0804a00c  _end
Checking the details of specific memory location:
(gdb) x/11cb 0x0804a000
 0x804a000:    72 'H'  101 'e' 108 'l' 108 'l' 111 'o' 32 ' '  119 'w' 111 'o'
 0x804a008:    114 'r' 108 'l' 100 'd'
Reading things is relatively intuitive:
Byte: x/1db <ADR>Int32(Word): x/1dw <ADR>Int16(Half-Word): x/1dh <ADR>Float: x/1fw <ADR>Array(int): x/<SIZE>dw <ADR>
Assembly instructions
Opcodes are the instructions programs performs. Each of them is represented by one line of code (opcode + operand). Depending on the instruction there might one or more operands and depending on the CPU (and instruction set). Representation/syntax might very between different CPUs and disassemblers, e.g.:
- Windows (Intel) : MOV DST,SRC
- Linux (AT&T): MOV SRC, DST
Categories of instructions:
Data transfer: mov, lea, les, push, pop, pushf, popfAritmetic: add, adc, sub, sbb, mul, imul, div, idiv, cmp, neg, inc, dec, xadd, cmpxchgFloating point: fadd, fsub, fmul, div, cmpLogical: and, or, xor, not, shl/sal, shr, sar, shld/shrd, ror/rol, rcr/rclControl: jmp, jcc, call, ret, int, into, boundString: move, compare, input, outputI/O: in, outConversion: movzx, movsx, cbw, cwd, cwde, cdq, bswap, xlatMisc: clc, stc, cmc, cld, std, cl, sti
Building Process
Stages of program building process:
Preprocessing: Include file processing, conditional compilation instructions and macrosCompilation: Generating assembly code with preprocessing output and source codeAssembly: Based on previous step, generation of assembly listing with offset (ending up with object file)Linking: Generating executable based on object file, including files/libraryLoading: Running program
Object and executable files come in a number of formats:
- COFF : Common Object File Format (used on Windows),
- ECOFF : Extended COFF
- XCOFF : eXtended COFF
- ELF : Executable and Linking format (used on Linux)
- PE :
- SOM/ESOM :
Object files contains sections:
- Executable Code
- Data
- Dynamic Linking Information
- Debugging Data
- Symbol Tables
- Relocation Information
- Comments
- String Tables
- Notes
Default sections in almost any executable format:
.text: Executable instruction codes.bss: Block Started by Symbol, un-initialized data and static variables..data: Contains initialized global and static variables (with values).rdata: this contains constants and string literals.reloc: Info required for relocating the image while loadingSymbol Table: Names and addresses, array of symbol entriesRelocation records:
You can use readelf command to read an object file. E.g.:
#include <stdio.h>

static void show(int i, int *ptr);

int main(void)
{
  int x = 5;
  int *xptr = &x;
  printf("Main: %d, Addr: %p\n", x, &x);
  show(x, xptr);
  return 0;
}

void show(int y, int *ptr)
{
  char var[7] = "ABCDEF";
  printf("Show: %d, Addr: %p\n", y, &y);
}
$ gcc -c objtest.c
$ readelf -a objtest.o
ELF Header:
   Magic:   7f 45 4c 46 01 01 01 00 00 00 00 00 00 00 00 00
   Class:                             ELF32
   Data:                              2's complement, little endian
   Version:                           1 (current)
   OS/ABI:                            UNIX - System V
   ABI Version:                       0
   Type:                              REL (Relocatable file)
   Machine:                           Intel 80386
   Version:                           0x1
   Entry point address:               0x0
   Start of program headers:          0 (bytes into file)
   Start of section headers:          984 (bytes into file)
   Flags:                             0x0
   Size of this header:               52 (bytes)
   Size of program headers:           0 (bytes)
   Number of program headers:         0
   Size of section headers:           40 (bytes)
   Number of section headers:         15
   Section header string table index: 14
 Section Headers:
   [Nr] Name              Type            Addr     Off    Size   ES Flg Lk Inf Al
   [ 0]                   NULL            00000000 000000 000000 00      0   0  0
   [ 1] .group            GROUP           00000000 000034 000008 04     12  13  4
   [ 2] .text             PROGBITS        00000000 00003c 0000aa 00  AX  0   0  1
   [ 3] .rel.text         REL             00000000 0002fc 000040 08   I 12   2  4
   [ 4] .data             PROGBITS        00000000 0000e6 000000 00  WA  0   0  1
   [ 5] .bss              NOBITS          00000000 0000e6 000000 00  WA  0   0  1
   [ 6] .rodata           PROGBITS        00000000 0000e6 000028 00   A  0   0  1
   [ 7] .text.__x86.get_p PROGBITS        00000000 00010e 000004 00 AXG  0   0  1
   [ 8] .comment          PROGBITS        00000000 000112 00001e 01  MS  0   0  1
   [ 9] .note.GNU-stack   PROGBITS        00000000 000130 000000 00      0   0  1
   [10] .eh_frame         PROGBITS        00000000 000130 000084 00   A  0   0  4
   [11] .rel.eh_frame     REL             00000000 00033c 000018 08   I 12  10  4
   [12] .symtab           SYMTAB          00000000 0001b4 000100 10     13  12  4
   [13] .strtab           STRTAB          00000000 0002b4 000048 00      0   0  1
   [14] .shstrtab         STRTAB          00000000 000354 000082 00      0   0  1
 Key to Flags:
   W (write), A (alloc), X (execute), M (merge), S (strings), I (info),
   L (link order), O (extra OS processing required), G (group), T (TLS),
   C (compressed), x (unknown), o (OS specific), E (exclude),
   p (processor specific)
 COMDAT group section [    1] `.group' [__x86.get_pc_thunk.ax] contains 1 sections:
    [Index]    Name
    [    7]   .text.__x86.get_pc_thunk.ax
 There are no program headers in this file.
 There is no dynamic section in this file.
 Relocation section '.rel.text' at offset 0x2fc contains 8 entries:
  Offset     Info    Type            Sym.Value  Sym. Name
 00000013  00000d02 R_386_PC32        00000000   _x86.get_pc_thunk.ax 00000018  00000e0a R_386_GOTPC       00000000   _GLOBAL_OFFSET_TABLE
 00000036  00000509 R_386_GOTOFF      00000000   .rodata
 0000003e  00000f04 R_386_PLT32       00000000   printf
 0000006e  00000d02 R_386_PC32        00000000   _x86.get_pc_thunk.ax 00000073  00000e0a R_386_GOTPC       00000000   _GLOBAL_OFFSET_TABLE
 00000095  00000509 R_386_GOTOFF      00000000   .rodata
 0000009d  00000f04 R_386_PLT32       00000000   printf
 Relocation section '.rel.eh_frame' at offset 0x33c contains 3 entries:
  Offset     Info    Type            Sym.Value  Sym. Name
 00000020  00000202 R_386_PC32        00000000   .text
 00000054  00000202 R_386_PC32        00000000   .text
 00000078  00000702 R_386_PC32        00000000   .text.__x86.get_pc_thu
 The decoding of unwind sections for machine type Intel 80386 is not currently supported.
 Symbol table '.symtab' contains 16 entries:
    Num:    Value  Size Type    Bind   Vis      Ndx Name
      0: 00000000     0 NOTYPE  LOCAL  DEFAULT  UND
      1: 00000000     0 FILE    LOCAL  DEFAULT  ABS objtest.c
      2: 00000000     0 SECTION LOCAL  DEFAULT    2
      3: 00000000     0 SECTION LOCAL  DEFAULT    4
      4: 00000000     0 SECTION LOCAL  DEFAULT    5
      5: 00000000     0 SECTION LOCAL  DEFAULT    6
      6: 00000066    68 FUNC    LOCAL  DEFAULT    2 show
      7: 00000000     0 SECTION LOCAL  DEFAULT    7
      8: 00000000     0 SECTION LOCAL  DEFAULT    9
      9: 00000000     0 SECTION LOCAL  DEFAULT   10
     10: 00000000     0 SECTION LOCAL  DEFAULT    8
     11: 00000000     0 SECTION LOCAL  DEFAULT    1
     12: 00000000   102 FUNC    GLOBAL DEFAULT    2 main
     13: 00000000     0 FUNC    GLOBAL HIDDEN     7 _x86.get_pc_thunk.ax     14: 00000000     0 NOTYPE  GLOBAL DEFAULT  UND _GLOBAL_OFFSET_TABLE
     15: 00000000     0 NOTYPE  GLOBAL DEFAULT  UND printf
 No version information found in this file.
Loading process
When it comes to loading process:
- OS reads file header’s, type validation, access permissions, memory requirement and instruction compatibility, confirming it’s an executable and calculating the memory requirements
- Allocate primary memory
- Copy addr space from secondary to primary memory
- Copy .text & .data sections from executable to primary memory
- Copy program arguments (argv/c) onto stack
- Initialize registers
- Jump to start routine (arg to stack)
As we frequently mentioned, the program has a number of areas:
Code/Text: InstructionsInitialized data segment: Statically allocated and global data with nonzero values. Independent segment from other processesUninitialized data (bss) segment: Global and static data with zero (uninitialized) values. Independent segment from other processesStack: For local automatic variables (inside a function), Grows downHeap: Related to dynamic memory (malloc, calloc, realloc, new), Grows Up
Data segment contains the initialized data, BSS and heap which are usually placed into a single contigious memory area.
Functions and Stack
Terms related to functions: function name, function parameters, local variables, static variables, global variables, return address, return value. Stack example on function call:
void Show(int i, char c, double d)      //PROTOTYPE
void Show(int i, char c, double d) {}   //DEFINITION
Show(10, 'c', 1.111);                   //CALL

          HIGH
   |----------------|
20 |     1.111      |
   |----------------|
16 |                |
   |----------------|
12 |       c        |
   |----------------|
 8 |       10       |
   |----------------|
 4 |   F RET ADDR   |
   |----------------|
 0 |   Saved EBP    |  <--- EBP
   |----------------|
-4 |      ...       |
   |----------------|
-8 |      ...       |  <--- ESP
   |----------------|
          LOW
When it comes to nested function calls, if we have:
int a (){
   b();
}

int main(){
   a();
}
Frames woud stack appropriately:
         HIGH
   |----------------|
   |  main's Frame  |  -> Before calling a() within main()
   |----------------|
   |   a() frame    |  -> Before calling b()
   |----------------|
   |   b() frame    |  -> In b()
   |----------------|
          LOW
On function call, stack frame is created, variables, parameters are pushed to stack. On return from function, operations are inverted. There’s variable de-allocation, frame destruction and top of the stack is return to previous frame. With a bit more details:
int f1(int p1){
  int z=3;
}

int main( int argc, char* argv[]){
  f1(6)
}
The stack layout would look like:
          HIGH
   |----------------|
24 |      ...       |  <--- Old EBP
   |----------------|
20 |      ...       |
   |----------------|
16 |      ...       |  <--- Old ESP
   |----------------|
 8 |       6        |
   |----------------|
 4 |      RET       |  <--- Return Address
   |----------------|
 0 |   Saved EBP    |  <--- EBP
   |----------------|
-4 |       3        |  <--- Current ESP
   |----------------|
          LOW
Moving Values Around
Placing “$” before a label name takes memory address instead of the value itself. To move the values you can use a number of options:
Between registers
movl %eax, %ebxBetween registers and memory
movl %eax, location
movl location, %eaxRaw value into a Register
movl $10, %ebxRaw value into a Location
movb $10, locationMoving data into an indexed memory location
BaseAddress (Offset, Index, DataSize) => first 2 params must be registers
IntArray:
.int 10, 20, 30, 40, 50
Selecting 20:
movl %eax, IntArray(0, 1, 33)
There are also a number of options when specifying the register/location:
movl $val, %edi : place val in EDImovl $val, (%edi) : place val in memory location pointed to by EDImovl $val, 4(%edi) : place val in memory location pointed by (EDI + 4)
Moving string around relies on the following instructions:
MOVSB : byte (8 bits)MOVSW : word (16 bits)MOVSL : double word (32 bits)
With strings, ESI should point to a memory location of a source and EDI should point to a memory location of a destination. So, before any of these instruction make sure you’re moving the source/destination to approriate registers (movl $Dest, %EDI, etc.). It’s important to mention DF (Direction Flag, part of EFLAGS registers), that controls the left-to-right and right-to-left string processing.
DF = 0 than ESI/EDI are incremented.
You can set DF flag using STD instruction or clear it with CLD instruction.
For instance, with strings, if you want to copy source to a destination, you would simplyu follow the steps:
- Load ESI with source
- Load EDI with destination
- Load ECX with string length
- Clear DF with CLD
- run “REP movsb”
- Set DF
To load string from memory into registers, two things:
- load into EAX registers
- string source should be pointed by ESI.
LODSB : Load a byte from memoy location into AL (ESI += 1)LODSW : Load a word from memory into AX (ESI incremented by 2 bytes)LODSL : Load a double word from memory into EAX (ESI += 4)
LEA : Load Effective Address (leal).
Storing strings into memory is similar:
- Stores into memory from EAX
- EDI points to destination
STOSB : store AL to memorySTOSW : store AX to memorySTOSL : store EAX to memory
Comparing strings:
- ESI with source string
- EDI with destination string
- DF defines inc/dec
CMPSB : compare byte valueCMPSW : cinoare word valueCMPSL : compare double word value
REPZ : repeat instruction while zero flag is setREPNZ : repeat instruction while zero flag is not set
Jumps (Unconditional & Conditional)
JMP <Label> : Something like GOTO.
Short (+/-128 bytes) , Near, Far (different segmennt)
Basically doing something like:
   jmp ExitProgram
   <CODE>
ExitProgram:
   movl $1, %EAX
   movl $10, %EBX
   int $0x80
CALL <Location>
There’s always a “RET” statement (Return) with every call. Call pushes the next instruction address onto the stack. That instruction is popped back into EIP on RET instruction
When it comes to conditional jumps (JA, JAW, JE, JG, JZ, etc.), they’re defined by flags (Zero Flag ZF, Parify flag PF, Overflow Flag OF, Sign Flag SF, Carry Flag CF). Only short/near jumps are supported.
xorl
LOOP instruction goes through a set of instructions a number of times (stored in ECX register). Example:
movl $5, %ECX
MyLoop:
    <CODE>
    LOOP MyLoop
LOOPZ : loop until ECX is not zero or the zero flag is not setLOOPNZ : loop until ECX is not zero or the zero flag is set
Functions
To define function:
.type MyFunc, @function
MyFunc:
    <CODE>
    RET
To call it, use “CALL MyFunc”. To pass arguments, you can use registers, Global memory or stack. To get value from a function, registers or global memory location.
BufferOverflow Example
It might be too early to go into this, but it might be useful to see “practical” usage of this knowledge. We’ll cover a Buffer Overflow in more details with the following/previous articles. For now, we’ll roughly show a stack behaviour on program execution and how it can potentially be exploited.
       HIGH
|----------------|
|    Function    |  -> Function
|----------------|
|    parameter1  |  -> Funcation parameters added in reverse order
|----------------|
|    parameter2  |
|----------------|
|   return adr   |  -> Where to go after function is finished
|----------------|
|      EBP       |  -> data pointer
|----------------|
|      buf       |
|      buf       |
|----------------|
|     HEAP       |
|----------------|
       LOW
Small example:
#include <stdio.h>
#include <string.h>

int main(int argc, char** argv)
{
   char buf[100];
   strcpy(buffer, argv[1]);
   return 0;
}
Looking at the strcpy, (gdb) disas main :
    0x000011a6 <+13>:    push   %ebx
    0x000011a7 <+14>:    push   %ecx
    0x000011a8 <+15>:    sub    $0x70,%esp
    0x000011ab <+18>:    call   0x11e0 <__x86.get_pc_thunk.ax>
Line 15 shows the array space allocation. The 0x64 is 100 bytes, but there’s also alignment to be counted in. We’ll cover this in “Stack structure” later on. To configure or disable compiler’s protection you can use certain parameters with gcc like:
-ggdb: producing debugging information specifically intended for gdb-mpreferred-stack-boundary=2: Changing the stack pointer alignment to 4 bytes boundary ( 2^2, default: 4 => 2^4 => 16 bytes)-m32: compile 32 bit obj, useful on 64 bit systems-fno-stack-protector: disables stack protection, canaries-z execstack: Passed to the linker, enabling “executable stack” (opposite, noexecstack)-no-pie: tell gcc not to make a Position Independent Executable (PIE). PIE is a pre-condition for ASLR (Address Space Layout Randomization), a kernel’s security feature to load binary and its dependencies into a random VM (Virtual Memory) location each time it’s run.-Wl,-z,norelro: disables a read-only relocation table area in the final ELF (executable and linkable format) where all relocations are resolved at run-time. [RELocation Read Only].-static: On some system it overrides the pie and prevents share library linking [ might be unncecessary ], no dynamic linking happening
$ gcc -ggdb -o ExampleDemo.c ExampleDemo
You can directly check the memory structure of a program/process by looking at the /proc/<PID>/maps file in linux:
559f5a90a000-559f5a90b000 r-xp 00000000 08:12 13774482                   /home/unknown/TEST_AREA/assembly/Example
 559f5ab0a000-559f5ab0b000 r--p 00000000 08:12 13774482                   /home/unknown/TEST_AREA/assembly/Example
 559f5ab0b000-559f5ab0c000 rw-p 00001000 08:12 13774482                   /home/unknown/TEST_AREA/assembly/Example
 559f5c496000-559f5c4b7000 rw-p 00000000 00:00 0                          [heap]
 7f7874991000-7f7874b78000 r-xp 00000000 08:12 3150380                    /lib/x86_64-linux-gnu/libc-2.27.so
 7f7874b78000-7f7874d78000 ---p 001e7000 08:12 3150380                    /lib/x86_64-linux-gnu/libc-2.27.so
 7f7874d78000-7f7874d7c000 r--p 001e7000 08:12 3150380                    /lib/x86_64-linux-gnu/libc-2.27.so
 7f7874d7c000-7f7874d7e000 rw-p 001eb000 08:12 3150380                    /lib/x86_64-linux-gnu/libc-2.27.so
 7f7874d7e000-7f7874d82000 rw-p 00000000 00:00 0
 7f7874d82000-7f7874da9000 r-xp 00000000 08:12 3150352                    /lib/x86_64-linux-gnu/ld-2.27.so
 7f7874f7c000-7f7874f7e000 rw-p 00000000 00:00 0
 7f7874fa9000-7f7874faa000 r--p 00027000 08:12 3150352                    /lib/x86_64-linux-gnu/ld-2.27.so
 7f7874faa000-7f7874fab000 rw-p 00028000 08:12 3150352                    /lib/x86_64-linux-gnu/ld-2.27.so
 7f7874fab000-7f7874fac000 rw-p 00000000 00:00 0
 7fffe9a03000-7fffe9a24000 rw-p 00000000 00:00 0                          [stack]
 7fffe9acc000-7fffe9acf000 r--p 00000000 00:00 0                          [vvar]
 7fffe9acf000-7fffe9ad1000 r-xp 00000000 00:00 0                          [vdso]
 ffffffffff600000-ffffffffff601000 r-xp 00000000 00:00 0                  [vsyscall]
$ sysctl -w kernel.randomize_va_space=0
echo 0 | sudo tee /proc/sys/kernel/randomize_va_space
Value 0 => disabled. Value 1 shifts the segments we mentioned above, value 2 adds data segment too.
GNU Debugger (GDB)
Debuggers are in general unavoidable/useful tools in programmers/reverse engineer’s life. Here we’ll show or share very few/basic commands. For more details you can check GNU Debugger Tutorial/Walkthrough.
To start:
$ gdb <program/executable>
To get a help on specific command:
(gdb) help <command>
To list the source code (press enter to view the rest of the code):
(gdb) list 1
To run the program:
(gdb) run 6 66
Use disassemble command with function name as a parameter:
(gdb) disassemble <function_name>
or
(gdb) disas <function_name>
To place a breakpoint at specific line:
(gdb) break <LINE_NUMBER>
On execution with run, program will be halted on specified breakpoint. You can then inspect the situation further, e.g. list registers details:
(gdb) info registers
Print parameter values:
(gdb) print <varName>
To continue execution after a breakpoint :
(gdb) continue
Examine memory via format letters:
- o : octal
- x : hex
- d : decimal
- u : unsigned decimal
- t : binary
- f : float
- a : address
- i : instruction
- c : char
- s : string
Size:
- b : byte
- h : halfword
- w : word
- g : giant, 8 bytes
Usage example, show quantity of size in format starting with the address :
x/<QUANTITY>xw <STARTING_MEMORY_ADDR: e.g. 0xaaaaaaaaaa>
 0xbffff218:    0x0000000a  0x00403fc8  0xbffff2e0  0x0000000a
 0xbffff228:    0xbffff2c8  0x00401280  0x0000000a  0x00000014
 0xbffff238:    0xb7ffe900  0x00401218
When you end up in a breakpoint, you can slowly go step-by-step with next instruction “s” or “c” for continue execution.
There are two main syntax branches, Intel and AT&T:
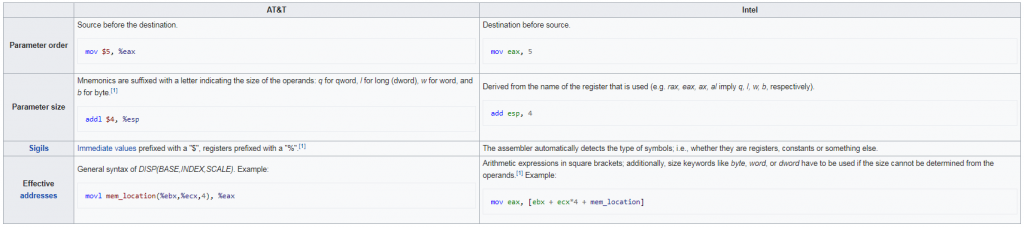
You can check or change the current one in GDB with:
(gdb) show disassembly-flavor
(gdb) set disassembly-flavor att
(gdb) set disassembly-flavor intel
Use help <cmd> to get additional info. E.g. :
info: Information about the program being debuggedinfo locals: Local variables of current stack frameinfo frame: All about selected stack frame or frame at ADDRbt: backtrace of all stack framesframe: Select and print a stack frameup: Select and print stack frame that called this onedown: Select and print stack frame called by this one- etc..
Conclusion
These are rough beginning, explaining and sharing info on most segments of Assembly language. A lot of work is ahead of us/you, so keep up, practice and don’t give up.


