
Introduction
Short info on Building Raspberry Pi GUI . Recently I had to create a quick home control GUI, with some basic details on it like weather details (daily & hourly stats), rtsp camera feed, local area map with live transit monitoring (exact details on when will transportation reach the neareast station), city road cameras, system utilization, network monitoring, etc. Some “basic” info that can help with every day life. There was only 16 hrs to do this, so I had to work fast.
There is unlimited number of ways we can do this, I tried a number of them:
- Java (awt/swt)
- .NET Forms
- Python (EasyGUI, PyQt, Eric, etc)
- Android
- Raspberry Pi with QT
Building Raspberry Pi GUI with Java (AWT/SWT)
I had high hopes with this one. Since I had some Java skills, this approach looked like the most intuitive to me, but the practical transition was more complicated.
The idea:
Develop things in Eclipse, compile JAR and simply running it on raspberry pi.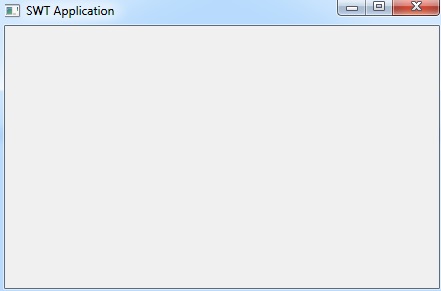
To speed things up, I used WindowBuilder, but hit a brick wall right away. Running the basic form on RaspPi failed. First there was an architecture mismatch, my Eclipse/WindowBuilder was running/compiling with 64bit and RaspPi3 was supporting the 32bit. After sorting that out, next, there were multiple library issues. Even after I tried to quickly import it, it sort some things out, but sequentially failed with version mismatch (swt-gtk-*).
It was time consuming, I dropped it.
Creating Raspberry Pi GUI with .NET Forms
I also had some experience with .NET Forms. With a quick check, it looked possible to run .NET apps with mono, furthermore there was a library compatible with different types of maps (greatmaps). Running basic form worked flawlessly on RaspPi, but when I imported GMap.NET.Core library, it failed. RaspPi/mono couldn’t handle it.
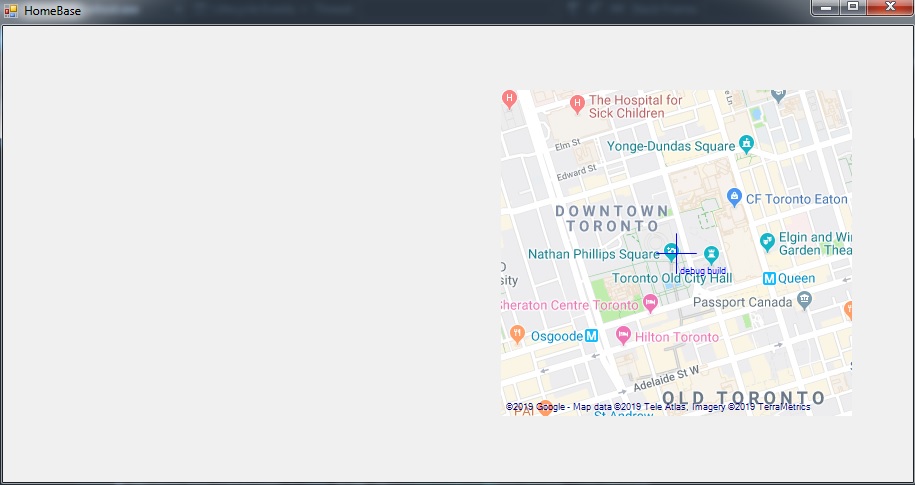
This dropped out too. Now I’m really short on time.
Building Raspberry Pi GUI with Python (EasyGUI, PyQT, Eric, etc)
This approach is probably the most logical choice, but I’m lacking GUI python skills. Since this path requires learning things, it’s most likely a time consuming path.
Out of desperation I gave it a shot, but it just confirmed my expectations.
Raspberry Pi GUI on Android
Running Android on RaspPi is definitely an option, but not in this case. RaspPi is already running/controling a lot of things (via scripts, crontabs, etc), transitioning them to Android is a bigger problem than simply building a GUI (although at this point I started questioning this).
Next: Building Raspberry Pi GUI with QT.
Raspberry Pi GUI with QT
Last hope. Long time ago I gained some experience with QT and unwillingly I tried it as well. It was a process: installing qt, remembering the syntax, installing & including libraries/modules, interacting with ui, etc.
$ apt install qt5-default qtcreator libqt5webkit5-dev qtlocation5-dev qtpositioning5-dev
I needed maps, and as suggested by multiple sources, I used a WebView + HTML template + EvaluateJS.
I lost hours due to an issue with WebView + Maps + OpenLayer vectors (markers). At one moment it works fine with map but doesn’t work with OpenLayer vectors, at another it’s vice versa, working fine with markers but map is not loading.
Note: Don’t load HTML/Template from file, use a webserver. Lesson learned.
Apparently, loading the HTML/Template from a file approach doesn’t get along with everything. Moving the HTML/Template file to webserver and loading an URL into WebView solved everything.
Maps were ready.
<html>
<head>
<link href="https://cdn.rawgit.com/openlayers/openlayers.github.io/master/en/v5.3.0/css/ol.css" rel="stylesheet" />
<script src="https://cdn.rawgit.com/openlayers/openlayers.github.io/master/en/v5.3.0/build/ol.js"></script>
</head>
<body>

<div id="map-canvas"></div>

<script>
	var baseMapLayer = new ol.layer.Tile({
		source: new ol.source.OSM()
	});

var map = new ol.Map({
  target: 'map-canvas',
  layers: [baseMapLayer],
  view: new ol.View({
    center: ol.proj.fromLonLat([43.6532, -79.3832]), //TORONTO
    zoom: 15
  })

});
var markers = [];

markers.push(new ol.Feature({
  geometry: new ol.geom.Point(
    ol.proj.fromLonLat([ 43.6532, -79.3832 ])
  ),
  name: '369'
}));

var colors = ['red', 'green', 'blue', 'black'];
var iconStyles = [];

colors.forEach(function(color) {
  iconStyles.push(new ol.style.Style({
    image:  new ol.style.Circle({
        radius: 6,
        stroke: new ol.style.Stroke({
            color: '#fff'
        }),
        fill: new ol.style.Fill({
            color: color
        })
    })
  }))
});

var labelStyle = new ol.style.Style({
    text: new ol.style.Text({
        font: '12px Calibri,sans-serif',
        overflow: true,
        fill: new ol.style.Fill({
            color: '#000'
        }),
        stroke: new ol.style.Stroke({
            color: '#fff',
            width: 3
        }),
        textBaseline: 'bottom',
        offsetY: -8
    })
});

var vectorSource = new ol.source.Vector({
  features: markers
});

var markerVectorLayer = new ol.layer.Vector({
  source: vectorSource,
  style: function(feature) {
      var name = feature.get('name');
          console.log("=> " + name);
      var iconStyle = iconStyles[parseInt(name)%colors.length];
          console.log(iconStyles[0]);
      labelStyle.getText().setText(name);
      return [iconStyle, labelStyle];
  }
});

map.addLayer(markerVectorLayer);

 function addFeature(lon, lat, name, color){

        var f = new ol.Feature({
			geometry: new ol.geom.Point(
            ol.proj.fromLonLat([lon, lat])
          )
        });

        var labelStyle = new ol.style.Style({
                text: new ol.style.Text({
                        font: '12px Calibri,sans-serif',
                        overflow: true,
                        fill: new ol.style.Fill({
                                color: '#000'
                        }),
                        stroke: new ol.style.Stroke({
                                color: '#fff',
                                width: 3
                        }),
                        textBaseline: 'bottom',
                        offsetY: -8
                })
        });

        f.setStyle( [iconStyles[color], labelStyle] );
    labelStyle.getText().setText(name);
        markerVectorLayer.getSource().addFeature(f);
 }

 function clearFeatures(){
        var features = markerVectorLayer.getSource().getFeatures();
        for (var i = 0, len = features.length; i < len; i++) {
                markerVectorLayer.getSource().removeFeature(features[i]);
        }
 }

clearFeatures();

function addDefaultMarkers(){
	addFeature(43.6532, -79.3832, 'HC', 2);
	addFeature(43.6532, -79.3842, 'TestPoint', 1);
}

addDefaultMarkers()

  </script>
</body></html>
Next, there’s a need to fetch and show different camera streams. This require a number of libraries/modules:
$ apt-get install qtmultimedia5-dev libqt5multimedia5-plugins libqt5gstreamer-dev
#include <QtMultimedia/QMediaPlayer>
QT       += core gui webkitwidgets multimedia multimediawidgets
#include <QtWebKitWidgets>
#include <QtMultimedia/QMediaPlayer>
#include <QGraphicsItem>
#include <QVideoWidget>
#include <QGraphicsVideoItem>
Next, I need weather info too, and accuweather is a grat source. They’re offering API/JSON, but that would require a “lot” of time to setup (getting an account, figuring out API, fetching, processing, formating output). They’re already offering a nice formatted output on their website, and we’re going to use that with PhantomJS. The idea is to capture only specific elements on the page (on an hourly basis) and simply display the image in QT. PhantomJS code for capturing screenshot of a specific DIV element and extracting it to a file:
var page = require('webpage').create();

page.open("https://www.accuweather.com/en/ca/toronto/m5h/hourly-weather-forecast/55488", function (status){
    if (status !== 'success') {
        console.log('Unable to load the address!');
    } else {
        window.setTimeout(function () {
            var bb = page.evaluate(function () {
                return document.getElementsByClassName("hourly-table")[0].getBoundingClientRect();
            });

            page.clipRect = {
                top:    bb.top,
                left:   bb.left,
                width:  bb.width,
                height: bb.height
            };

            page.render('/home/pi/HCGUI/hourly.png');


            bb = page.evaluate(function () {
                return document.getElementsByClassName("panel-list")[1].getBoundingClientRect();
            });

            page.clipRect = {
                top:    bb.top,
                left:   bb.left,
                width:  bb.width,
                height: bb.height
            };

            page.render('/home/pi/HCGUI/daily.png');

            phantom.exit();
        }, 200);

    }
});
Result is pretty good:
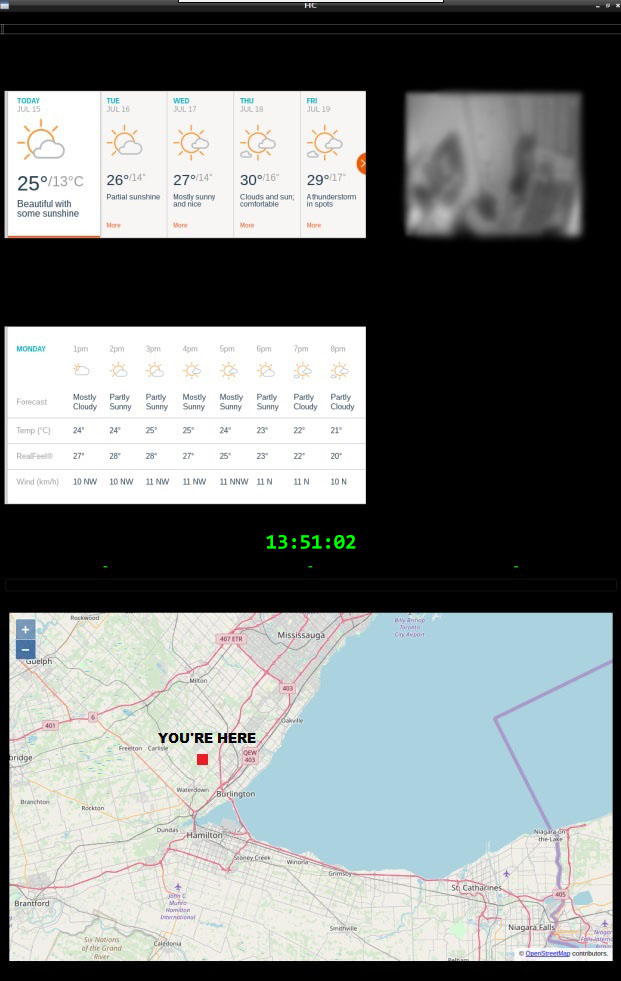
It’s not fully completed, but adding other segments like network/system/home stats should be trivial after this. Transit system vector drawing works just fine, but the detailed breakdown (disassembling android app to gain insights in service/API interaction) will be covered later on.
Conclusion
This is just a reference, a raw example of the path to glory (through sweat and tears) 🙂 . I can’t say this is the best approach, depending on the skillset you have you can probably do a better job, but this “Hackaton” session provided a good enough results for me.
![CloudFront Over S3 [CDN]](https://cdn.cyberpunk.rs/wp-content/uploads/2019/09/cloudfront_over_s3_bg-500x275.jpg "CloudFront Over S3 [CDN]")
![Stack Structure Overview [GDB]](https://cdn.cyberpunk.rs/wp-content/uploads/2020/06/stack-structure-overview-bg-500x275.jpg "Stack Structure Overview [GDB]")
