")
Mordor. It’s almost normal for things to go downhill when you’re working on something, especially when you least expect it. More over I think it’s safe to say that Murphy’s law dominates the IT scene (like nowhere else). Not working as expected, implementation problems, sudden issues, permissions, licenses, hardware dying, service dying, ISP/Provider dying, stolen or interrupted telephone/internet cables, the only thing that didn’t happen yet is that the building I’m in didn’t collapse. So I do expect an earthquake coming my way very soon..

We’ve diverged from the subject, getting back to the story. This is a random info on various network related issues, optimizations, tuning network performance, including helpful vars, flags, tools, notes, everything we could think of. It’s not complete, but we’ll get there. For now, it’s here for reference, and it might give someone ideas on how to solve their own issues.
Tuning Network Performance: The Issue
Recently we had an opportunity to “fight” with some unknown issues on a dedicated server were Apache (LoadBalancer, mod_proxy) seemingly & occasionally stopped responding (ongoing issue). It appears that the outages are irregular without any rules. User load on APIs is not overloading the server, network traffic “seems” normal, enough memory/space/CPU power, maybe a bit older version of apache (Prefork MPM) but it was working just fine till a couple of months ago.
– apache: curl_easy_perform failed: connect() timed out!
– kernel: possible SYN flooding on port 443. Sending cookies
– apache: curl_easy_perform failed: Operation timed out after 10000 milliseconds with 0 bytes received
– read-function of plugin `apache//apache’ failed. Will suspend it for 20.000 seconds
– kernel: nf_conntrack: table full, dropping packet
– __ratelimit: 126 callbacks suppressed
– device eth1 entered promiscuous mode / device eth1 left promiscuous mode
– ECONNREFUSED
Some of those messages can make you look in the wrong direction, wrong places. For instance, although you’ve set the backlog variable to high values, NGinx/Apache doesn’t use those kernel/core values and defaults back to 511. You have to specifiy it (e.g. listen 80 backlog=16384, ListenBacklog 16384)
There were a couple of issues. FIN_WAIT2 jump (specific user), not affecting the normal operation and SYN_RECV jump (precursor of outage). Tuning network performance is a tedious work, especially on live/production systems, trying not to discrupt the service while you’re doing the optimizations.
FIN_WAIT2 Jump
The FIN_WAIT2 happens on client side or in this case on server/LoadBalancer side contacting some backend server. Logs showed that this is related to a certain user calling specific function/URL (PHP script/file). So, some inner problem, most likely development issue and finishing things properly on backend server side.

SYN_RECV Jump
The second SYN_RECV jump issue is more troubling. Not clearly visible on the Grafana graph above, but the order in which everything happens is the same. There’s a small jump in SYN_RECV & CLOSE_WAIT connections following (16:16, 16:17) and then a jump in LAST_ACK follows up sequentially (16:18 – 16:21). Which is a normal socket/connection related order of steps:

Digging for solutions
Tuning network performance and apache is a pit, a bottomless hole. A lot of variables, moving parts and potential culprits. This segment will include simple trial & error approach and no guarantee that any of this is going to work for you.
Connection Speed / Bandwidth usage
For bandwidth usage you can use almost anything, nload, iftop, etc. The current usage/AVG was: 20/30 Mbit/s down/up.
When it comes to connection speeds, it might be tricky to get right on a production server. Quick:
$ curl -s https://raw.githubusercontent.com/sivel/speedtest-cli/master/speedtest.py | python -
I had a mixed results like 450/150, 360/120, 350/350 down/up.
Linux port exhaustion
This is the first thing that crossed my mind. Not being able to connect to apache might be a sign of port exhaustion. Connections in different states (ESTABLISHED, TIME_WAIT,..) all take and keep those slots until completed. The “ephermal port range” defines the maximum number of outbound sockets server can create. While tuning network performance changing these ranges/values might be a good idea:
$ cat /proc/sys/net/ipv4/ip_local_port_range
or
$ sysctl net.ipv4.ip_local_port_range

 32768    61000
So the default range is 28.232. Another value:
$ sysctl net.ipv4.tcp_fin_timeout

60
Defines the minimum time these sockets will stay in TIME_WAIT state (unusable after being used once). If we take that into consideration, the maximum your system can handle at any moment is (61000-32768) / 60 => 470 sockets/s. In order to increase that, you should increase the range and maybe reduce the timeout:
$ sysctl net.ipv4.ip_local_port_range="15000 61000"
$ sysctl net.ipv4.tcp_fin_timeout=30
With that, we should be able to handle ~1500 connections/s (per given ip/port).
Couple of other adjustments frequently used and mentioned are tcp_tw_recycle & tcp_tw_reuse. The tcp_tw_recycle was removed from kernel (somewhere around 4.12 if I’m not mistaken), it was “recycling” TIME_WAIT sockets and causing issues with NAT. The tcp_tw_reuse is allowing for TIME_WAIT to be reused when it’s safe from protocol viewpoint.
SYNFlood and SYN_RECV Reduction
Connections are in SYN_RECV state until they receive ACK.

The sudden jump in SYN_RECV can be a sign of:
- SYN Flood attack (intentionally not giving ACK)
- Client software/side/speed issue (not sending ACK)
- Routing issue (not receiving ACK)
- Issue with the firewall/iptables (dropping ACK)
It looks like none of those is the main reason for my issues. There is no SYN flood, the quantity of SYN connections is relatively low for it to be an attack. Aside from that, we even simulated a SYN flood attack, and the behaviour is quite different. We could understand it’s the client issue if it’s only one or two clients, but here we have more than a dozen IPs/Clients involved at the same time. Route tests didn’t show any signs of troubles and IPTables look ok. Each of those points were re-checked probably a dozen times.
Adjusting net.ipv4.tcp_synack_retries / net.ipv4.tcp_syn_retries to 3 helped a bit. At the moment of outage, instead of ending up with 250+ SYN_RECV this dropped the number to < 50.
To fight the SYN Flood attacks, set:
- tcp_max_syn_backlog (to higher value)
- tcp_syn_retries (6)
- tcp_synack_retries (3)
- tcp_syncookies (1)
TIME_WAIT Reduction
TIME_WAIT purpose (and RFC 1337 hazards):
- prevent delayed segments : Ending up mixed with a wrong connection (same source/port/destination etc).
- ensure remote end closed the connection : In cases where last ACK is lost, remote end stays in the LAST-ACK state. Getting SYN from the next connection (matching sequence number), it will end up with a RST, and the new connection will be aborted.
From the APP’s perspective, TIME_WAIT sockets do not consume any memory. In kernel, 3 structures:
- Hash table of connections: used to locate existing connection. The size is possible to override via thash_entries. Existing size:
 $ dmesg | grep TCP
 [    0.524772] TCP established hash table entries: 262144 (order: 9, 2097152 bytes)
 [    0.525015] TCP bind hash table entries: 65536 (order: 8, 1048576 bytes)
 [    0.525084] TCP: Hash tables configured (established 262144 bind 65536)
- Set lists of connections (“death row”): used to expire conn in the TIME_WAIT state.
- Hash table of bound ports:
Solution – Add more:
- server ports (80, 81, 82…)
- client ports (net.ipv4.ip_local_port_range)
- client IP (additional IPs, LoadBalancer)
- server IP (additional IPs on the web server)
Congestion
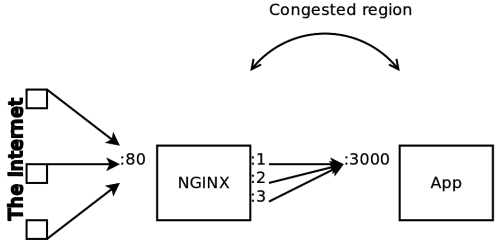
Mentioned here for the sake of illustration, relevant to tuning network performance.
Dropped Packets / Dropping Packets
Packet drop surely doesn’t sound good , a sure sign of an issue. With the kernel 2.6.37, dropped packet count includes:
- Softnet backlog full
- Bad / Unintended VLAN tags
- Unknown / Unregistered protocols
- IPv6 frames when the server is not configured for IPv6
Finding the reason behind drops can be difficult, but might help in tuning network performance. Amongs many things it can be related to:
- NIC’s buffers getting full, overflowing with incoming bursts of traffic
- CPU receiving NIC interrupts is very busy and unable to process
- some cable/hardware/duplex issues
- some bug in NIC driver
Quick test is to force NIC into promiscuous mode:
$ ifconfig <interface> promisc
and whating rx_dropped counter. If it stops incrementing while the NIC is in promiscuous mode, the issue is more likely related to previously listed reasons. Small number of dropped packets is not worth investigating.
Usual suspects are packet queues size, so increasing them on both interface/variable might help:
$ ifconfig eth1 txqueuelen 5000  (Default: 1000)
$ sysctl -w net.core.netdev_max_backlog=3000 (Default: 1000)
The log message “kernel: nf_conntrack: table full, dropping packet” implies that the connection table is full. It can be caused by an attack or a very busy server. The default maximum is set to 65.536 connections, but this can be easily exhausted on a heavy traffic servers. It might help to increasing the maximum number of connections being tracked and reduce the tracking timeouts or to completely disable connection tracking.
$ echo 524288 > /proc/sys/net/netfilter/nf_conntrack_max
$ sysctl -w net.netfilter.nf_conntrack_max=262144
The recommended size: conntrack_max = RAM_SIZE (in bytes) / 16384 / (ARCH / 32). E.g. for 8 GB RAM, x86_64 => 8 * 1024^3 / 16384 / 2 => 262144
Find current count of connections:
$ cat /proc/sys/net/netfilter/nf_conntrack_count
15030
Find info on every connection:
$ tail /proc/net/nf_conntrack

ipv4     2 tcp      6 431989 ESTABLISHED src=xxx.xxx.xxx.xxx dst=yyy.yyy.yyy.yyy sport=60534 dport=8009 src=yyy.yyy.yyy.yyy dst=xxx.xxx.xxx.xxx sport=8009 dport=60534 [ASSURED] mark=0 secmark=0 use=2
 ipv4     2 tcp      6 116 SYN_SENT src=yyy.yyy.yyy.yyy dst=xxx.xxx.xxx.xxx sport=54928 dport=443 [UNREPLIED] src=xxx.xxx.xxx.xxx dst=3.124.133.3 sport=443 dport=54928 mark=0 secmark=0 use=2
 ipv4     2 tcp      6 431998 ESTABLISHED src=xxx.xxx.xxx.xxx dst=yyy.yyy.yyy.yyy sport=55188 dport=8009 src=yyy.yyy.yyy.yyy dst=xxx.xxx.xxx.xxx sport=8009 dport=55188 [ASSURED] mark=0 secmark=0 use=2
Extract source:
$ cat /proc/net/nf_conntrack | awk -F ' *|=' '{print $8}' | sort | uniq -c | sort -rn
Delete conntrack entries:
$ apt install conntrack
$ conntrack - D --src IP_ADDR > /dev/null
Maybe we can use some script to manage abusing IPs:
#!/bin/bash
LIMIT=30
cat /proc/net/nf_conntrack | awk -F '  *|=' '{print $8}' | \
    sort | uniq -c | awk -v limit=$LIMIT'$1 > limit {print $0}' |
while read count ip
do
    # BLACKLIST - Locally defined ipset
    echo ipset add <BLACKLIST> $ip
    ipset add <BLACKLIST> $ip
    conntrack -D --src $ip > /dev/null
done
If we check “netstat -i” :
$ netstat -i

 Kernel Interface table
 Iface      MTU    RX-OK RX-ERR RX-DRP RX-OVR    TX-OK TX-ERR TX-DRP TX-OVR Flg
 enp0s31f  1500 20100443      0    150 0      12641647      0      0      0 BMRU
 lo       65536   234128      0      0 0        234128      0      0      0 LRU
Frequently mentioned dropwatch tool:
$ sudo apt-get install -y libnl-3-dev libnl-genl-3-dev binutils-dev libreadline6-dev
$ git clone https://github.com/pavel-odintsov/drop_watch
$ cd drop_watch/src
$ vim Makefile # comment out the -Werror argument to gcc
$ make

$ sudo ./dropwatch -l kas
Initalizing kallsyms db
dropwatch> start
Enabling monitoring...
Kernel monitoring activated.
Issue Ctrl-C to stop monitoring

4 drops at tcp_v4_do_rcv+cd (0xffffffff81799bad)
14 drops at tcp_v4_rcv+80 (0xffffffff8179a620)
4 drops at sk_stream_kill_queues+57 (0xffffffff81729ca7)
4 drops at unix_release_sock+20e (0xffffffff817dc94e)
5 drops at igmp_rcv+e1 (0xffffffff817b4c41)
1 drops at igmp_rcv+e1 (0xffffffff817b4c41)
Try on one side:
$ ping -i 0.01 -c 4000 <TARGET_IP>
and on the other see if you can catch them:
$ tcpdump -en -i interface_name icmp and host <REMOTE>
Impact of RTT on TCP Retransmissions
Memory issue
Sometime defaults might not be enough on busy server. Raising them to 8MB might help:
$ sysctl -w net.core.wmem_default=8388608
$ sysctl -w net.core.rmem_default=8388608
Max receive/send buffer size (8 Mb):
net.core.rmem_max=8388608
net.core.wmem_max=8388608
Kernel receive/send buffer for each TCP connection:
net.ipv4.tcp_rmem=8192 873800 8388608
net.ipv4.tcp_wmem=4096 655360 8388608
- Values
- First value => minimum receive/send buffer for each TCP conn.
- Second value => default receive/send buffer (this value overrides net.core.rmem_default).
- Third value => maximum receive/send buffer. Kernel will auto tune these values between min-max range
- Units are in page size( default: 4 kb)
TCP Variables, States & Things
Various parameters you can use while tuning network performance and/or services.

- CLOSED: There is no connection.
- LISTEN: The local end-point is waiting for a connection request from a remote end-point i.e. a passive open was performed.
- SYN-SENT: The first step of the three-way handshake, connection request has been sent to a remote end-point i.e. an active open was performed.
- SYN-RECEIVED: The second step of the three-way handshake, an acknowledgement for the received connection request as well as a connection request has been sent to the remote end-point.
- ESTABLISHED: The third and final step of the three-way handshake, the connection is open.
- FIN-WAIT-1: The first step of an active close (four-way handshake) was performed. The local end-point has sent a connection termination request to the remote end-point.
- CLOSE-WAIT: The local end-point has received a connection termination request and acknowledged it e.g. a passive close has been performed and the local end-point needs to perform an active close to leave this state.
Connections in this state indicates that the process does not perform active close after passive close. OS knows that the remote application closed the connection and waits for the local app to do the same. App should detect such situations and close the socket appropriately. CLOSE_WAIT will remain until the process closes. - FIN-WAIT-2: The remote end-point has sent an acknowledgement for the previously sent connection termination request. The local end-point waits for an active connection termination request from the remote end-point.
Too many connections in this status might indicate that a remote application dies (when in CLOSE_WAIT) or fails to perform active close after passive close. - LAST-ACK: The local end-point has performed a passive close and has initiated an active close by sending a connection termination request to the remote end-point.
- CLOSING: The local end-point is waiting for an acknowledgement for a connection termination request before going to the TIME-WAIT state.
- TIME-WAIT: The local end-point waits for twice the maximum segment lifetime (MSL) to pass before going to CLOSED to be sure that the remote end-point received the acknowledgement. Necessary to avoid new connection reciving duplicate packets from previous connection.
Variables:
-
net.ipv4.tcp_synack_retries(default: 5) : Variable responsible for controlling the number of retransmissions in Linux. Defines how many times to retransmit the SYN, ACK reply to a SYN request. Each retransmission takes 30-40 seconds, so default timeout of passive TCP connections is ~180 sec. Don’t use values larger than 255. Similarly, there’snet.ipv4.tcp_syn_retries. -
net.ipv4.tcp_retries1: sets how many retries are needed before giving up responding to a tcp connection request -
net.ipv4.tcp_retries2: control the number of times the kernel resends data to a remote host that has already established a connection -
net.ipv4.tcp_max_syn_backlog: specifies the maximum number of clients that can accept SYN synchronization packets (global), that is, the semi-connection upper limit. Maximum number of remembered connection requests, which are still did not receive an acknowledgment from connecting client. Max half-open connections -
net.core.somaxconn: refers to the maximum number of clients that the server can accept to process data (per port), that is, the upper limit of the connection is completed. Maximum number of backlogged connections allowed for each TCP port
$ sysctl -w net.ipv4.tcp_max_syn_backlog=16384
$ sysctl -w net.core.somaxconn=16384
/proc/sys/fs/file-max: The maximum number of concurrently open files-
/proc/sys/net/core/rmem_max: Maximum TCP Receive Window /proc/sys/net/core/wmem_max: Maximum TCP Send Window/proc/sys/net/ipv4/tcp_rmem: memory reserved for TCP receive buffers/proc/sys/net/ipv4/tcp_wmem: memory reserved for TCP send buffers/proc/sys/net/ipv4/tcp_timestamps: Timestamps (RFC 1323) add 12 bytes to the TCP header…/proc/sys/net/ipv4/tcp_sack: TCP Selective Acknowledgements. They can reduce retransmissions, however make servers more prone to DDoS Attacks and increase CPU utilization./proc/sys/net/ipv4/tcp_window_scaling: support for large TCP Windows (RFC 1323). Needs to be set to 1 if the Max TCP Window is over 65535.
TCP Socket Buffer:
/proc/sys/net/ipv4/tcp_wmem and /proc/sys/net/core/wmem_max: tcp send window,increasing the tcp send and receive buffers will increase the performance a lot if (and only if) you have a lot of large files to send.
net.ipv4.tcp_wmem = 4096 65536 524288
net.core.wmem_max = 1048576/proc/sys/net/ipv4/tcp_rmem and /proc/sys/net/core/rmem_max: tcp receive window,If you have a lot of large file uploads, increasing the receive buffers will help.
net.ipv4.tcp_rmem = 4096 87380 524288
net.core.rmem_max = 1048576
net.ipv4.tcp_max_tw_buckets = 6000
net.ipv4.tcp_syncookies = 1
net.ipv4.tcp_max_orphans = 262144
$ sysctl -w net.ipv4.netfilter.ip_conntrack_tcp_timeout_established=54000
$ sysctl -w net.netfilter.nf_conntrack_generic_timeout=120
$ sysctl -w net.ipv4.netfilter.ip_conntrack_max=
tcp_fin_timeout: time that must elapse before TCP/IP can release a closed connection and reuse its resources. (default: 60 seconds, recommended 15-30 seconds)tcp_keepalive_interval: time between isAlive interval probes (default: 75 seconds, recommended: 15-30 seconds)tcp_keepalive_probes: number of probes before timing out (default: 9, recommended 5)tcp_tw_recycle: fast recycling of TIME_WAIT sockets (default: 0)tcp_tw_reuse: reusing sockets in TIME_WAIT state for new connections when safe from protocol viewpoint (default: 0)
For netfilter parameters check:
$ sysctl -a | grep netfilter
To reduce number of TIME_WAIT connections, we can decrease the time they’re kept in this state, from the 120s default to 30-60s:
$ sysctl -w net.netfilter.nf_conntrack_tcp_timeout_time_wait=30
$ sysctl -w net.netfilter.nf_conntrack_tcp_timeout_fin_wait=30
Check nf_conntrack_tcp_timeout_established as well.
-
nf_conntrack_tcp_timeout_established: Dead connections are deteleted automatically from the “tracking” table and it’s related to this timeout (seconds). Lowering this value will keep the table “lean”, faster, but it might also break long running idle TCP conn. Default: 43200 / 12 hrs net.ipv4.tcp_max_tw_buckets: Max number of sockets allowed in TIME_WAITnet.ipv4.tcp_max_orphans: Sockets which have been closed and no longer have a file handlenet.core.netdev_max_backlog: Max number of packets that can be queued on interface input
# Is sysctl -p enough?
Apache / LoadBalancer
MaxKeepAliveRequests – limits the number of requests allowed per connection. Calculating the ServerLimit/MaxClients limits:
Total System Memory – Buffer / Apache MB usage = ServerLimit / MaxClients
Get the AVG Apache/httpd process size:
$ ps -ylC apache2 --sort:rss | awk '{sum+=$8; ++n} END {print "Tot="sum"("n")";print "Avg="sum"/"n"="sum/n/1024"MB"}'
If for instance we have 64 GB RAM and an Apache/httpd AVG process size oscilating between 16 and 26 MB, counting in the buffer of 7GB, we “should” be ok with 2560 ServerLimit/MaxClients ( on the limit : (64000 – 7000) / 21=> 2700 ).
Network Stats Info
Parsed netstat info:
$ cat /proc/net/netstat | awk '(f==0) { i=1; while ( i<=NF) {n[i] = $i; i++ }; f=1; next} \
     (f==1){ i=2; while ( i<=NF){ printf "%s = %d\n", n[i], $i; i++}; f=0}'

SyncookiesSent = 11949526
SyncookiesRecv = 57666108
SyncookiesFailed = 79328163
...
OutOfWindowIcmps = 5460
LockDroppedIcmps = 78
...
DelayedACKs = 2368131080
DelayedACKLocked = 464175
DelayedACKLost = 15289742
...
ListenOverflows = 73201601
ListenDrops = 73201601
...
TCPLossUndo = 2351886
TCPLoss = 2884841
TCPLostRetransmit = 249760
Network interface info:
$ ethtool - S <interface>

NIC statistics:
      rx_packets: 5293673
      tx_packets: 3488532
      rx_bytes: 5629999533
      tx_bytes: 440614352
      rx_broadcast: 19757
      ...
Check the current state of connections:
$ netstat -an

Active Internet connections (servers and established)

Proto Recv-Q Send-Q Local Address               Foreign Address             State

tcp        0      0 xxx.xxx.xxx.xxx:443         xxx.xxx.xxx.xxx:63870          SYN_RECV
tcp        0      0 xxx.xxx.xxx.xxx:55696       xxx.xxx.xxx.xxx:8009           ESTABLISHED
tcp        1      0 xxx.xxx.xxx.xxx:56874       xxx.xxx.xxx.xxx:8009           CLOSE_WAIT
tcp        0      0 xxx.xxx.xxx.xxx:43596       xxx.xxx.xxx.xxx:3306           TIME_WAIT
tcp        1      0 xxx.xxx.xxx.xxx:35040       xxx.xxx.xxx.xxx:8010           CLOSE_WAIT
tcp        0      0 xxx.xxx.xxx.xxx:40326       xxx.xxx.xxx.xxx:3306           TIME_WAIT
tcp        0      0 xxx.xxx.xxx.xxx:47738       xxx.xxx.xxx.xxx:8009          ESTABLISHED
Get the general interface table:
$ netstat -i

Kernel Interface table
 Iface       MTU Met    RX-OK RX-ERR RX-DRP RX-OVR    TX-OK TX-ERR TX-DRP TX-OVR Flg
 eth0       1500   0 194228467      4      0      0  9541608      0      0      0 BMRU
 eth0:1     1500   0      - no statistics available -                            BMRU
 eth1       1500   0 76654535368 3259396   1678      0 52203250031      0      0      0 BMRU
 lo        65536   0 333696284      0      0      0 333696284      0      0      0 LRU
Flags:
- RX-OK : Correct packets received on this interface.
- RX-ERR : Incorrect packets received on this interface
- RX-DRP : Packets that were dropped at this interface.
- RX-OVR : Packets that this interface was unable to receive.
Networking statistics:
$ netstat -s (--statistics)

Ip:
     Forwarding: 2
     17325532 total packets received
     818 with invalid headers
     0 forwarded
     0 incoming packets discarded
     17324671 incoming packets delivered
     10541295 requests sent out
     70 dropped because of missing route
 ...
 Tcp:
     31763 active connection openings
     8 passive connection openings
     115 failed connection attempts
     3748 connection resets received
     42 connections established
     17098356 segments received
     10463442 segments sent out
     1816 segments retransmitted
     103 bad segments received
     37381 resets sent
...
Get network timer info:
$ netstat -o

Active Internet connections (w/o servers)
 Proto Recv-Q Send-Q Local Address               Foreign Address             State       Timer
 tcp        0      0 xxx.xxx.xxx.xxx:http         xxx.xxx.xxx.xxx:34248       SYN_RECV    on (0.97/0/0)
 tcp        0      0 xxx.xxx.xxx.xxx:https         xxx.xxx.xxx.xxx:61350       SYN_RECV    on (0.95/0/0)
 tcp        0      0 xxx.xxx.xxx.xxx:54056         xxx.xxx.xxx.xxx:8009        TIME_WAIT   timewait (25.82/0/0)
 tcp        0      0 xxx.xxx.xxx.xxx:35576         xxx.xxx.xxx.xxx:8009        ESTABLISHED off (0.00/0/0)
- Recv-Q : the number of bytes received by the local network interface but not yet read by the connected process
- Send-Q : the number of bytes sent to the other side of the connection but not yet acknowledged by the remote host
Network listening sockets: $ netstat -l
PID using the socket: $ netstat -p
Routing cache: $ netstat -C
Routing info:
$ netstat -r

 Kernel IP routing table
 Destination     Gateway         Genmask         Flags   MSS Window  irtt Iface
 default         192.168.1.1     0.0.0.0         UG        0 0          0 enp0s31f6
 169.254.0.0     0.0.0.0         255.255.0.0     U         0 0          0 enp0s31f6
 192.168.1.0     0.0.0.0         255.255.255.0   U         0 0          0 enp0s31f6
Route flags:
- A Receive all multicast at this interface.
- B OK broadcast.
- D Debugging ON.
- M Promiscuous Mode.
- O No ARP at this interface.
- P P2P connection at this interface.
- R Interface is running.
- U Interface is up.
- G Not a direct entry.
You can also use “ss” utility to get some socket statistics, similar to netstat:
# specific state
$ ss -tan state time-wait
#specific port
ss -tan 'sport = :80' | awk '{print $(NF)" "$(NF-1)}' | sed 's/:[^ ]*//g' | sort | uniq -c
Conclusion
The issue we mentioned, although slightly eleviated, still persisted, so an efforts had to be involved in moving/updating that production server to up-to-date apache version (codeit) and moved from MPM Prefork to MPM Event.
Customizing and tuning network performance/apache varies from system to system, from server to server, circumstances might be different, services running might have different requirements, so this is a compilation of various approaches in optimizing the overall system/network performance. It might not work for you, but it might as well help you in general, giving you ideas and clues on where to look, what to use.

![How to Fix Bootloop Issue on Android [TWRP, Nexus 6P]](https://cdn.cyberpunk.rs/wp-content/uploads/2020/07/bootloop-issue-android-bg-500x275.jpg "How to Fix Bootloop Issue on Android [TWRP, Nexus 6P]")
")